Spatial Monitoring and Reporting Tool (SMART)
The policy goal for the RGC and MAFF is: an abundant, productive and diverse fisheries for Cambodia. FIA are in charge of management, control and inspections and community engagement to ensure these goals are met. FiA as the designated government institution, responsible for management of the inland fisheries focuses on fisheries management with 3 interconnected approaches:
1. Conservation of habitats important for fishery resources, including endangered species;
2. Enforcement (and awareness building) of restrictions on destructive fishing methods and access to Fisheries Conservation Areas (FCA); and,
3. Strengthening of Community Fisheries through establishment and support for Community Fisheries (CFi) to co-manage local fishery resources and Community Fish Refuge (CFR) that identify and protect dry season refuge areas for fish and Other Aquatic Animals (OAA).
The Fisheries Administration implements an information management solution for patrolling and law enforcement for fisheries. This uses the Spatial Monitoring and Reporting Tool (SMART) developed by the World Conservation Society (WCS), which is an evidence-based data collection and reporting system for wildlife and forestry law enforcement monitoring. SMART is a combination of software, training materials and implementation standards for systematic law enforcement and monitoring patrols. It includes different software tools to collect, process and report data collected during inspections in tables and maps, with tools to assist in planning of patrols. Although initially developed for wildlife conservation in terrestrial habitats, conservation management activities, including biodiversity conservation, law enforcement, natural resources use it has found application in fisheries as well.
The core app runs on phones and uses a highly customisable data model, for structuring the data that is collected during an inspection. This depends on the legal framework on Fish Conservation Areas and illegal fishing, as well as any other elements to allow fisheries staff to identify fishing operations, including aquaculture and post-harvest activities related to processing, trade and transport. Data models used for SMART freshwater and marine enforcement were developed and training on use of the recording of inspections on tablets and phones were provided under technical support by FAO CAPFISH, with the SMART patrolling approach was introduced as the main recording and reporting tool used by FiA, Inspectorates and FiAC, starting in 2020.
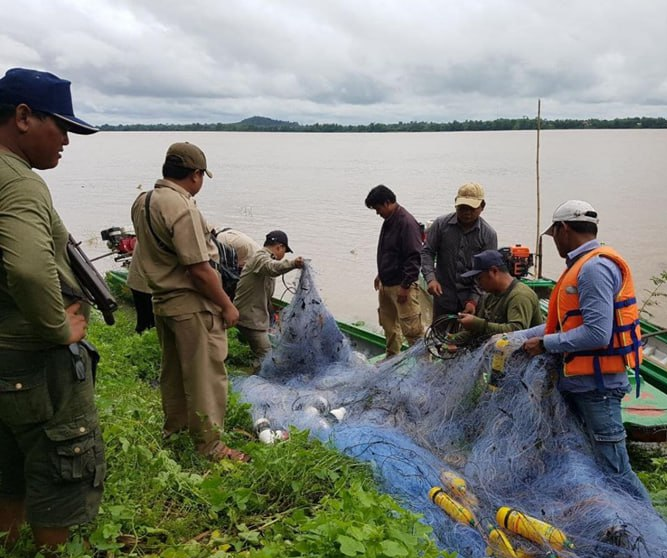
Important elements of the focus on illegal fishing include preventing the construction, sale, storage and use of illegal fishing gears and unauthorised fishing in restricted areas. Surveillance and enforcement are overseen by the Department of Fisheries Affairs (DFA) at central level and implemented by provincial and district competent authorities at sub-national levels, in conjunction with executive arms of the RGC’s Ministry of Interior. Violations of gear and area restrictions can result in the confiscation of catch and/or fishing gears, fines and even incarceration. Enforcement also extends to aquaculture, flooded forest fires, fish traders and processors who may be fined for purchasing or selling fish or fish products caught using illegal fishing gear.
SMART has been used by FiA for both marine and freshwater fisheries for law enforcement with over 200 rangers trained and using the tools throughout the year. During 2022 over 2500 marine and 45,000 freshwater inspections were done.
Open...